How can I tell if my forecast is any good?
In our last conversation, we shared some examples of time series forecasting models ranging from classical time series methods, judgment-based forecasts and rules of thumb, regression-based models, and more. How do you know which one to use, and which one is the best?
To start, the definition of ‘best’ depends on the problem you’re trying to solve. Imagine yourself as a revenue analyst, here are the kinds of forecasting questions you’d ask and answer:
- What’s the expected revenue for product X this quarter?
- What would the revenue for product X be if we increased our direct marketing by $Y?
For the first question, the ‘best’ model is the model that is the most ‘accurate’. For the second question, you’re more interested building the best possible estimate of how those relationships affect the outcome.
For this article, I’ll focus on answering the first question, and will answer the second question in a follow-up article.
Accuracy - The Basics
Error
To help us answer the first question “What’s the expected revenue for product X this quarter?”, you might come up with a number and then measure how your forecast differed from what actually happened after the fact. Here’s an example:
\[ \text{Error} = \text{forecast} - \text{actuals} \]
So let’s say that you predicted that revenue will be $26M, but the actuals came in at $25M. So the error is $26M-$25M = $1M.
| product | forecast | actuals | error |
|---|---|---|---|
| Product 1 | 26 | 25 | 1 |
How to Lie with Accuracy
While this is a very simple and straightforward example, you’d be surprised how this can get you into trouble.
Here’s an example that I’ve seen here at work. Let’s say that you are forecasting for not just one product, but two products. Then naively, how would you calculate the total error across all of your products? Let’s say that \(\text{Error}_1\) is the error for product 1 and \(\text{Error}_2\) is the error for product 2, then the Total Error would be the total of these two error numbers:
\[ \begin{aligned} \text{Total Error} &= \text{Error}_1 + \text{Error}_2 \\ &=(\text{forecast}_1 - \text{actuals}_1) + (\text{forecast}_2 - \text{actuals}_2) \end{aligned} \]
Can you spot the problem? Imagine that \(\text{Error}_2\) is negative. To make it concrete, imagine that \(\text{Error}_1\) is still $1M and \(\text{Error}_2\) is $22M - $23M = $1M, then the Total Error is $1M - $1M = $0M.
| product | forecast | actuals | error |
|---|---|---|---|
| Product 1 | 26 | 25 | 1 |
| Product 2 | 22 | 23 | -1 |
| Total | 48 | 48 | 0 |
Great, we have a perfect model! Then, if we want to find out how well this model performed on average you can take the mean:
\[ \begin{aligned} \text{Mean Error} &= \frac{1}{n}\text{Total Error} \\ &= \frac{1}{2} * 0 \\ &= 0 \end{aligned} \]
Did we just create the perfect model?
No! The errors just offset. While you can happily report that your model reported perfect accuracy at the aggregated level, this might make you overconfident in how well your model is truly performing. And as analysts, our north star should be truth.
Mean Absolute Error
So how do we be more honest? First off, you can solve this issue by taking the absolute value of the errors. Then in the previous example, the Total Error becomes $2M instead of $0, and you have a much better measure of the true accuracy of your model.
| product | forecast | actuals | absolute error |
|---|---|---|---|
| Product 1 | 26 | 25 | 1 |
| Product 2 | 22 | 23 | 1 |
| Mean | MAE: 2/2 = 1 |
So in this example, this better reflects the reality that the average forecast was off by $1M. And this error metric is still fantastic for explainability because it’s easy to understand.
But what if the scales of the two products were drastically different? Let’s say, sales in product 1 were in $M (millions) and sales in product 2 were in $K (thousands). Then you would be potentially overestimating or underestimating the average performance of your model!
We can solve this by scaling our performance metrics.
Scaled Errors
In order to compare forecasts in which the underlying data has widely different scales, you should use a scaled error metric.
Mean Absolute Percent Error
How many of us have been asked to provide a forecast or a prediction that should be within +/- 2% of the final number? This is a great example of an accuracy measure, and is known as “Mean Absolute Percent Error” or MAPE. Like Mean Absolute Error (MAE), MAPE is very easy to understand, calculate, and explain. It can also be used when you have forecasts at different scales.
\[ \begin{aligned} \text{MAPE} &= \frac{100\%}{n} \times \left(\frac{|\text{Error}_1|}{\text{Actuals}_1} + \frac{|\text{Error}_2|}{\text{Actuals}_2} \right) \\ &= \frac{100\%}{2} \times \left(\frac{|1|}{25} + \frac{|-1|}{23}\right) \\ &= 4.18\% \end{aligned} \]
| product | forecast | actuals | absolute error | absolute percent error |
|---|---|---|---|---|
| Product 1 | 26 | 25 | 1 | 1/25 = 4% |
| Product 2 | 22 | 23 | 1 | 1/23 = 4.34% |
| Mean | 1 | 4.18% |
Careful with MAPE!
For many cases, MAPE is an ideal metric to use because of how easy it is for folks to understand and interpret. However, MAPE isn’t perfect - it can be infinitely large. For example, let’s say that you had a revenue forecast at $9M and the actuals came in at $1M. Then, the percent error is 800%. Then, our data becomes:
| product | forecast | actuals | absolute error | absolute percent error |
|---|---|---|---|---|
| Product 1 | 26 | 25 | 1 | 1/25 = 4% |
| Product 2 | 22 | 23 | 1 | 1/23 = 4.34% |
| Product 3 | 9 | 1 | 8 | 8/1 = 800% |
| Mean | 269.5% |
Now, instead of making our model look better than it actually is, it’s making it look worse because that one product is skewing the results.
This example is due to the non-symmetric nature of MAPE. If you set your forecast to $0 or very nearly zero, then the percent error will be at most 100%. But if you set your forecast infinitely higher than the actuals, then the MAPE would go to infinity too. Here at work I’ve seen scores in the 127,000% MAPE range.
So how do you handle this? You might be tempted to just report the total MAPE score and call it good, right?
| product | forecast | actuals | absolute error | absolute percent error |
|---|---|---|---|---|
| Product 1 | 26 | 25 | 1 | 4% |
| Product 2 | 22 | 23 | 1 | 4.34% |
| Product 3 | 9 | 1 | 8 | 800% |
| Total | 57 | 49 | 10 | 10/49 = 16.33% |
So then you can confidently say that your model is off by +/- 16.33% when you only look at the total aggregated performance. But on average, this doesn’t change the fact that your average model performance accuracy is about 270%. In practice, it’s common to have a single forecast have infinite percent error, which means that the average model performance accuracy goes to infinity too!
How would you compare different models if both models have infinite error?
Alternatives to MAPE
So if you have models that both report infinite errors and want to compare them against each other, then there are two approaches: sMAPE and MASE.
sMAPE (Symmetric Mean Absolute Percent Error)
The ‘symmetric’ MAPE score (SMAPE) is a MAPE score that is adjusted for the non-symmetric nature of MAPE and bounds the score between 0% and 200%. However, the interpretation becomes more complicated because they aren’t true percentages in the MAPE sense…rather, you can consider the error to range between 0 and 200, with lower being better.
This is the preferred metric for state of the art forecasting competitions (the M-series) because it lets you get a score across any kinds of time series.
MASE (Mean Absolute Scaled Error)
Another common metric is the Mean Absolute Scaled Error (MASE), which compares a model’s accuracy against some baseline model. The most common baseline model is a naive model, where the predicted value is simply the most recent historical value. So for instance, in a naive model where you have actual revenue of $0 this month, you would predict that next month’s revenue would also be $0.
| Jan | Feb | Mar | Apr | |
|---|---|---|---|---|
| Actuals | 0 | 1 | 4 | 6 |
| Naive Prediction | 0 | 1 | 4 | |
| Naive Model Error | 1 | 3 | 2 |
Then, to calculate the scaled error you simply divide your new model’s error by the average Naive error. Here’s an example with a new model that simply predicts 3 for each month after January:
| Jan | Feb | Mar | Apr | Mean | |
|---|---|---|---|---|---|
| Actuals | 0 | 1 | 4 | 6 | |
| Naive Prediction | 0 | 1 | 4 | ||
| Naive Model Error | 1 | 3 | 2 | 2 | |
| New Model | 3 | 3 | 3 | ||
| Absolute Scaled Error | |3-1|/2 = 1 | |3-4|/2 = 1/2 | |3-6|/2 = 3/2 | (1 + 1/2 + 3/2)/3 = 1 |
The final MASE Score in the above example is 1, which indicates that this model does not perform any better or worse than the baseline Naive model. If the MASE score was less than 1, that means that the new model’s accuracy is better than the baseline model, while if the MASE score is above 1, that means that the new model’s accuracy is worse.
MASE is useful because it can give you an interpretable forecast, especially when you have an existing baseline that you want to compare against. Often a +/- 2% accuracy metric isn’t possible, but if your model offers a measurable improvement against an existing baseline then it might still be worth using your model despite not getting within 2% MAPE of your target!
Summary of Error Metrics
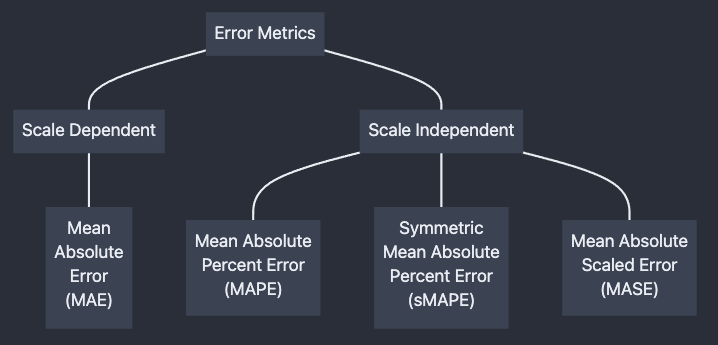
| Metric | Pros | Cons |
|---|---|---|
| MAE | Most Interpretable | Best if units are the same |
| MAPE | Interpretable, works across multiple scales | Can be infinite |
| sMAPE | Scales errors between 0 and 200 | Less interpretable than MAPE |
| MASE | Easy to interpret, can’t go to infinity | Less interpretable than MAPE |
Validating the Model (Backtesting)
The above examples all compared a single point forecast for multiple products, but did you just get lucky that one quarter, or does your method consistently deliver accurate results? How would you know?
The way to answer this question is to use “time series cross-validation”, also known as “Backtesting” your forecasting method because you’re testing how your model would have performed back in the day.
The intuition behind this is that you repeatedly calculate the forecast at different periods in your history, but only using the subset of historical data that would have been available to you at the time.
This diagram from Hyndman’s Forecasting: Principles and Practice explains this concept, where each dot is a point in time. The blue dots represent the historical training data that you use in your algorithm, and the red dot is the point in time in which you forecast:

You then calculate your forecast accuracy using one of the metrics listed above, and calculate the average over all of the historical backtests.
The downside of judgmental forecasts
So this is the downside of using analyst intuition and judgmental forecasts - most of the time you can’t go back in time and recreate your judgmental forecast using the knowledge available to you at that moment in history. So without taking an algorithmic approach, we often find ourselves stuck unable to find ways to measurably improve our forecasts because we fundamentally can’t determine how ‘good’ our forecasts are!
Conclusion
In addressing a handful of common error metrics, I’ve left out a lot of details - there are many, many more types of error metrics out there and choosing the right error metric is a challenging task. When evaluating different forecasting models, it’s common to combine and weight the outputs from multiple error metrics and arrive at a weighted ‘score’ in which you base your model selection decision. This is where the art of analysis comes in - not only is it important for you to understand how various models work and how to tweak their performance, you must also impartially create a model selection process that works for you and your business problem.
I also only covered a problem in which ‘best’ means the model with the highest accuracy score (or conversely, the model with the least amount of error). In a future post, I’ll talk about what it means to use a model to find relationships and help you guide decisionmaking, where accuracy takes a backseat to interpretability!